As the end of the year approaches, many investors trying to find how to invest $500 show concern about the potential slowdown in the economy. This caution is with good reason, as the slowdown in China and lull in US job growth point to a high likelihood of the US economy being affected.
A recent Washington Post Article, “Economists are starting to warn about the risk of a new U.S. recession”, confirms this point, saying “A growing chorus of prominent economists and analysts are arguing those dynamics could tip the world — and the United States along with it — into recession within the next two years. The fear is showing up in the recent wild swings in financial markets, rare outside of broader economic downturns.”
As economists claim there is a high possibility of a recession, institutional investors should prepare accordingly. The questions arise: How will my investor portfolio be affected? How can I prepare my portfolio for an economic shock?
The general rule of thumb during an economic slowdown is that losses go up by 1.5x in a recession and by 2x in a severe recession. However, based on our experience, these simplistic scenarios do not capture the full dynamics across different portfolios.
Stress testing and cash flow more fully demonstrate how ones’ portfolio will be affected. MonJa’s Portfolio Monitoring Solution provides vintage cash flow projections for different economic scenarios.
Cash Flows in A Benign Environment:
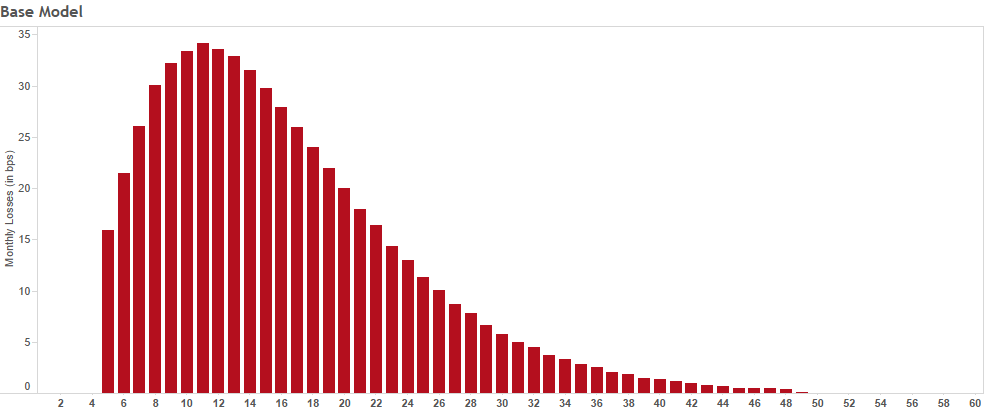
In a normal environment, losses start to peak 10 to 12 months after loan origination. After that, there is a slow drop off as loans amortize and principals get paid back to investors. The grade/term allocation demonstrates a very smooth projected loss based on the risk group and term loan length.
Cash Flows In A Recession:
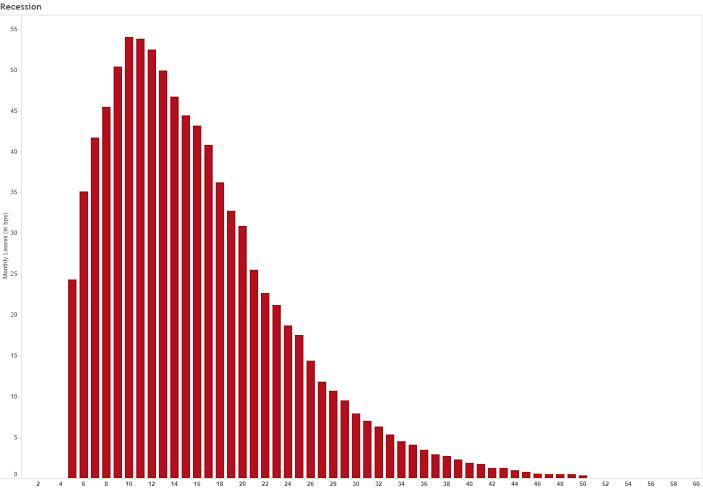
In a recession scenario, not only are the peaks higher – but they also drop off much more steeply due to the burn-out effect. These dynamics will be very different in a seasoned portfolio, where the existing amortization serves to buffer losses – this is something that cannot be captured simply in a loss multiplier. Each grade & term will have a different sensitivity to a recession. The uneven level of loss pattern is influenced by the intensity of the recession, which differs across grade & time.
Investors may also want to drill down further in a heat map view, to see the geographic concentration of high delinquencies – and to be able to position the portfolios accordingly.
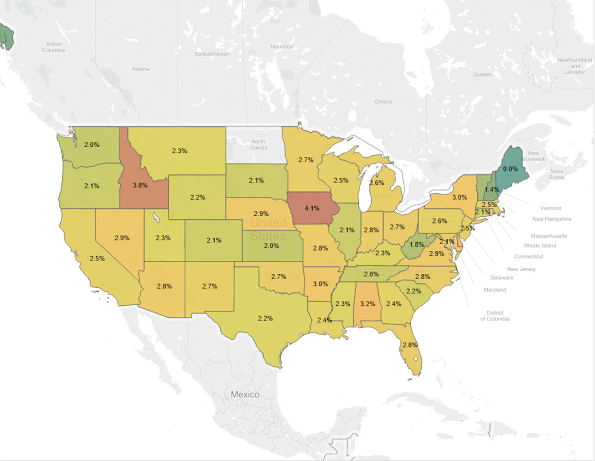
Based on a random sample of loans with similar basic criteria, the dispersion of delinquency is not the same as the image, as not all states perform in lockstep. Similar coloring suggests a regional correlation, yet certain states standout in their deviation of the trend.
Investors- how will you prepare for the potential economic downturn? What portfolio indicators are most important to you and why?